




Graphical Analysis

Description of Graphical Analysis
Graphical Analysis is a data visualization and analysis application developed by Vernier Software & Technology, designed for educational purposes within science and mathematics. This app is available for the Android platform, allowing users to download it to explore data collection and analysis effectively. It serves as a powerful tool for students and educators alike, enabling them to graph and interpret data gathered from Vernier sensors and other sources.
The app supports multi-sensor data collection, which is essential for conducting experiments across various scientific disciplines. Users can choose from different data collection modes, including time-based, event-based, and drop counting. This flexibility allows for tailored data collection that meets the specific needs of various experiments. Additionally, the app facilitates customizable data collection rates and durations, providing users with the ability to adjust parameters based on their experimental design.
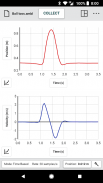
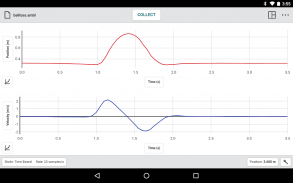
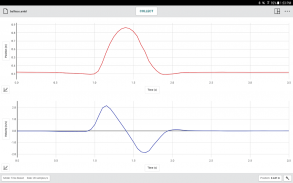
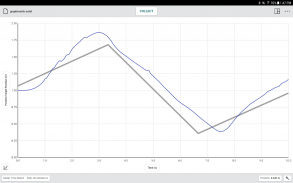
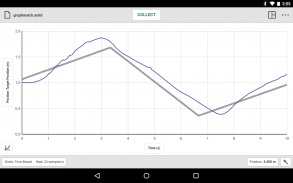
Graphical Analysis offers a user-friendly interface that enables the simultaneous display of one, two, or three graphs. This feature is particularly beneficial for users looking to compare different datasets visually. The ability to view data in a table format or alongside a graph enhances the analytical capabilities of the app, allowing for a comprehensive understanding of the data being analyzed. Moreover, users can draw predictions directly on the graphs to explore concepts and address misconceptions in real-time.
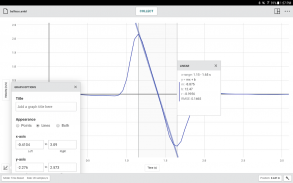
The app includes several analytical tools designed to enhance data interpretation. For instance, the Tangent tool allows users to determine instantaneous rates of change. This is particularly useful in physics and calculus applications where understanding rates is crucial. The Integral tool is available for finding the area under a curve, which can be significant in various scientific analyses and applications.
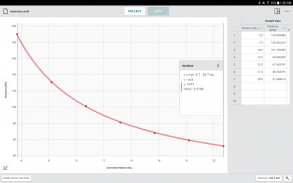
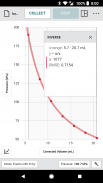
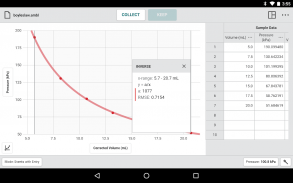
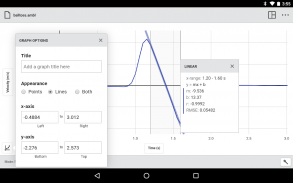
Statistical calculations are also a vital component of Graphical Analysis. Users can compute essential statistics such as mean, minimum, maximum, and standard deviation. This statistical support aids in data interpretation, ensuring that users can derive meaningful insights from their experimental results. Additionally, the app provides options for performing curve fits, including linear, quadratic, and natural exponent fits. This feature is particularly useful for modeling relationships within data sets and understanding underlying patterns.
For those interested in expanding their data analysis capabilities, the app allows for the addition of calculated columns based on existing data. This functionality is beneficial for users looking to linearize data or investigate related concepts further. The app encourages exploration and discovery, enabling users to delve deeper into their data analysis processes.
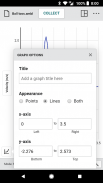
Graphical Analysis emphasizes collaboration and sharing, allowing users to create text annotations and add titles to graphs. This feature enhances the clarity of presentations and reports, making it easier for users to communicate their findings effectively. The app supports exporting graphs and data, which can be used in lab reports or printed for further use. Users can save files in the .ambl format to the cloud, facilitating easy exchange with Graphical Analysis on other devices, including Chromebooks, Windows, macOS computers, and iOS devices.
Exporting data in .CSV format is another significant feature, enabling users to analyze their data in spreadsheet software such as Excel, Google Sheets, and Numbers. This capability allows for advanced data manipulation and further analysis outside the app, providing users with a comprehensive toolkit for their educational needs.
The app also includes customizable font sizes, catering to users who wish to present their data in a more accessible format. This feature is particularly beneficial in classroom settings, where visual clarity can enhance understanding during presentations.
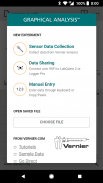
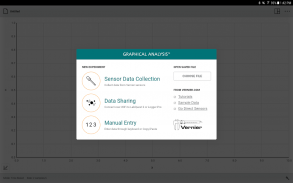
Graphical Analysis supports data collection through Vernier Go Direct sensors, which utilize Bluetooth wireless technology for seamless connectivity. It also accommodates Go Wireless Heart Rate and Go Wireless Exercise Heart Rate monitors, expanding the range of experiments users can conduct. For those who may not have access to the necessary hardware, manual entry of data can be performed, ensuring that users can still engage with the app without additional purchases.
The app encourages an interactive learning environment, allowing for data sharing via Wi-Fi connections to devices such as LabQuest 2, LabQuest 3, or Logger Pro 3. This feature fosters collaboration among users, enhancing the educational experience. Overall, Graphical Analysis serves as a robust tool for students and educators, providing a wide array of features that support data collection, analysis, and sharing within the context of science and mathematics education.
For more information on Data Sharing, visit http://www.vernier.com/css.


